Keywords:
TwinCAT IoT, Analytics, MQTT, Storage Provider, Data Logger
1 Overview
1.1 Equipment health management plan
The mechanism of health management for automation equipment is to collect, store, and analyze the health status of production equipment. The health data, analysis tools, and health indicators for equipment in different industries may vary, but the methods of data collection, transmission, and storage are similar. The health data of automation equipment is provided by one or more PLCs, but the health status analysis is usually performed on another PC within the local area network or on the Internet. The data provider and user are connected through IoT technology.
TwinCAT provides two IoT-based equipment health management solutions: one is TwinCAT 3 Analytics Suite, and the other is PLC free programming for IoT data communication. Both use the MQTT protocol. In fact, these two solutions can collect any process data for later use by users. As shown in the figure:

In the above figure, after TwinCAT Controller or Data Agent establishes an MQTT data flow with MQTT Message Broker:
· TwinCAT Storage can reference this data stream and continuously "import" the data source to local storage.
· The locally stored files can be copied to other computers or saved locally.
· Other computers can display curves through TwinCAT Messurement or perform offline analysis through TwinCAT Analytics Workbench.
· TwinCAT HMI provides controls and methods to display changes in data sources in real time.
· TwinCAT Analytics Runtime is running on the edge device for online analysis.
Note: Not every application needs to use all the above features. This article introduces the simplest and easiest-to-implement application, which only includes the first three points: creating data streams, local storage, and curve display. This routine was originally designed to meet the remote data collection requirements of a self-learning project.
1.2 Mode A: Based on TwinCAT Analytic Suite
1.2.1 Data collection
(1) Storage of DataLogger cache files
The TwinCAT Data Logger is used for data caching and can exist locally on the PLC or create a data stream via MQTT.
-Local direct acquisition of single machine
This is the simplest case, where the cache file exists directly in the PLC's startup directory "C:\TwinCAT\3.1\Boot\Analytics". Typically, TwinCAT XAE is installed on a Beckhoff IPC, and the PLC program runs on this IPC. The data analysis software is also executed on this IPC.
- Through MQTT data flow
This is a commonly used method that can leverage the advantages of MQTT. The PLC needs to connect to the external network to send temporary data to the specified MessageBroker data stream. There is no need to install XAE and analysis tools on the PLC, so the requirements for the controller are not high, and an embedded PC can meet them.
(2) Data records of the specified time period of the StorageProvider
For using MQTT data streams, it is necessary to set the target variable within the target time period in the TwinCAT Storage Provider, and then start data logging. If there is only a DataLogger and no StorageProvider, the default is to save only the most recent 5 seconds of data.
1.2.2 Data post-processing
Data collection is for use. If the data is not post-processed, there is no need to collect it. TwinCAT DataLogger generates data in a special file format (.tay). Using the TwinCAT Scope View to load the .tay file, waveform curves can be displayed for various analyses. It can also be exported as a .csv or .txt file for processing by user-defined third-party tools.
1.3 Mode B: PLC writes code to access data through IoT
1.3.1 Data collection
(1) Producing data side
The PLC uploads the generated data to MQTT. Except for referencing the IoT library, everything else is customized by the user.
(2) Storage data side
The PLC obtains data from the MQTT Broker and writes it to a csv file or database. Except for referencing the IoT library, everything else is user-defined.
Note: The Beckhoff China STS team provides basic procedures for the data provision side and storage side. Users only need to modify the structure of the collected data and keep both sides consistent.
1.3.2 Data post-processing
Define the data format according to the PLC storage, such as how to analyze the csv file later or how to extract data from the database for analysis.
2 Configuration method:
2.1 Preparation
2.1.1 Controller side
Authorized: Controller side TF3500 | TC3 Analytics Logger
Installation package: already included in XAR or XAE, no need to install separately
Controller: CX5130, WES7, TC3.1.4024.15(XAR)
2.1.2 MQTT service side
That is, the function of caching Analytics data on the MQTT server. If you install the MQTT server on the cloud, the Analytics temporary transit data will be stored on the cloud. If you install the MQTT server on a PC on the local area network, the Analytics data will be stored on the PC on the local area network.
The commonly used testing tool is to install mosquitto on a cloud server or a PC to make it an MQTT server:
Installation package: mosquitto-1.4.14-install-win32.exe,
2.1.3 Data recording and storage side
Only temporary data files are stored on the MQTT server. If you need to record and store data, you need to install TC3 XAE and TF3520 Analytics StorageProvider on the IPC:
Authorized by: TF3520 Analytics Storage Provider,
Installation package: TF3520-Analytics-Storage-Provider.exe
2.1.4 Analytic data post-processing side
TwinCAT 3 XAE and Analytics Engineering should also be installed on the IPC for data post-processing.
Installation package: TC3-Measurement-Full.exe,
Tip: When installing, check the box for TE35xx Analytics Engineering. By default, this option is not selected.
(1) Method 1: TC3ScopeExportTool.exe
Execution file:
C:\TwinCAT\Functions\TF3300-Scope-Server\TC3ScopeExportTool.exe
C:\TwinCAT\Functions\TE130X-Scope-View\TC3ScopeExportTool.exe
(2) Method 2: TC3 Scope View
TC3 Scope View's built-in functions
(3) Others
Authorized by: TE3500 | TC3Analytics Workbench
TE3520 | TC3 Analytics Service Tool
Note: TE35xx also has a 7-day trial license
2.2 Configuration of data acquisition
2.2.1 If the single machine collects directly locally
(1) PLC program
When providing data for PLC programs, it is important to add the attribute {attribute: 'TcAnalytics'} to all variables that need to be collected.
The example PLC program only has one variable, Main.bTest, and no program code:
PROGRAM MAIN VAR is {attribute: 'TcAnalytics'} bTest:BOOL; END_VAR |
; |
(2) Configure Data Logger
If the solution explorer does not contain the ANALYTICS item, select Show Hidden Configurations | Show ANALYTICS Configuration from the right-click menu of the TwinCAT project

Then select "Add Data Logger" from the right-click menu of ANALYTICS

The default configuration of the Data Logger is as follows:
The meaning of each item is on page 19 of TF3500_TC3_Analytics_Logger_en-us_draft.pdf. When using local storage on a single machine, you can directly use the default configuration. On the other two pages, TLS is set to None and Time Source is set to None.

If a variable with the attribute {attribute: 'TcAnalytics'} already exists in the PLC compiled program when creating the Data Logger, a PLC Stream will be automatically generated under the Data Logger:

If there is no variable requiring a Logger when it is created, but attributes are added to the PLC variable later
{attribute: 'TcAnalytics'}
After the program is compiled, PLC Stream will automatically appear under Data Logger.Select the PLC variables to be collected
Check the variable on the Selection page of PlcStream:

Only variables with the attribute {attribute: 'TcAnalytics'} will appear in the list of choices.
You can also check the Data Handling page, although you can simply use the following default settings:

Here, File is the default file path for storing collected data, and %TC_BOOTPRJPATH% represents
"C:\TwinCAT\3.1\Boot\Analytics"
(4) Activate the configuration and download and run the PLC program

According to the update time of the folder, you can find the latest record


The file name has changed, but the file size remains the same. Comparing the file modification date, we can infer that the meaning of the last part of the file name, T09-32-02-029, is 9:32:02:029 milliseconds. The modification time of 17:32 is Beijing time, which corresponds to 09:32 in Greenwich Mean Time (time zone 0).
The file size remains the same, but the time difference between the two files is 5s120ms. It is expected that the 10kB data only contains historical data from the most recent 5s120ms in the Logger.
(6) Observe the data record with Target Browser

Find the folder (last 4 characters 387A) on the TcAnalyticsFile page of TargetBrowser:
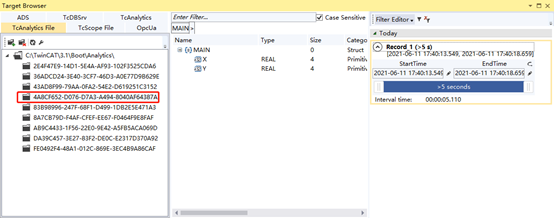
You can see the collected variables and the record length, which is currently 00:00:05:110
2.2.2 If it is through MQTT data flow
Complete steps (1) to (4) of the previous section "If the standalone machine collects directly locally".
Then modify the parameter settings for the Data Logger in step (2). If you are using an MQTT server, the first DataFormat should be set to Binary, and the MQTT Host Name should be filled in with the server's IP address.

For the simplest anonymous access, directly use port 1883, the Topic can be modified or left as default, and the ClientID can be filled in or left blank.
(1) Check the status of PlcStream
If everything is normal, after the controller activates the configuration and the PLC starts running, the MQTT Connection status on the Online page of PlcStream should display "Connected":

Tip: If it is not working properly, it will display a red Disconnected message. At this point, you need to check the controller's authorization, network connection, and whether the Data Logger service is started. If everything is correct, you can try setting it to automatically start and boot the PLC program, and then restart the controller.
(2) Observe the data record with Target Browser
Open the target browser from the main menu TwinCAT | Target Browser | TargetBrowser, find the IP of the MQTT Broker on the TcAnalytics page, and expand the tree structure to display Live Data:

If the variables in the Live Data under the IP address displayed are consistent with the variables defined in the program and selected in the Data Logger, it indicates that the data collection (Data Logger) through MQTT has been successful.
2.3 Data recording and storage
The following operations are performed on the same IPC or another IPC installed with TC3 XAE and Storage Provider that is used to configure the Data Logger.
(1) Configure StorageProvider Recorder
Open the directory:
C:\TwinCAT\Functions\TF3520-Analytics-StorageProvider\WinService\
Execution procedures:
TcAnalyticsStorageProvider_Config.exe

When setting up the Message Broker information, the most important thing is the IP address. The port for anonymous access is always 1883. For initial testing, use anonymous access. After the settings are complete, click Check Settings and when it displays OK, you can return. Then click the Start button and confirm that the status is Running.
(2) Open StorageProvider Recorder
Main Menu TwinCAT | Analytic | StorageProvider Recorder
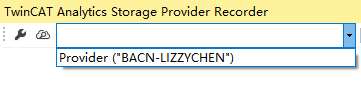
If the list is empty, click the Configure icon to check the Connection Settings:

After entering the correct MQTT server IP and port, click Check Settings, and the normal result should be OK.
If the drop-down box selected by the broker is still empty, it is necessary to check the provider configuration and authorization of the local machine.
(4) Select the data records to be stored
Select the variable from the Target Browser and drag it to the Storage Provider Recorder

You can select a single or multiple variables at a time, and then set the TopicAlias and recording duration:

The time settings for A and B in the above figure are mutually exclusive. A refers to single recording, while B refers to cyclic recording. Setting A resets B, and vice versa.
For example, if the setting is set to 2 minutes at A, the record item in the Storage Provider Recorder will be added with one item "Main_XYZ", as shown in the figure:

(5) Start data recording
Click the START button in front of the specified Topic:

It can be seen that the button before MAIN_XYZ will later display a blue STOP, indicating that recording is currently in progress and can be manually stopped.
(6) Downloading recorded data
After 2 minutes, the icon in front of MAIN_XYZ will again display a red START, indicating that recording has stopped and can be manually started. Each time a recording is made, a file will be generated. Click the Save button at the top of the interface and select the MAIN_XYZ just recorded:

Click Download and select the storage path.
(7) View the data record file
To view the file just recorded in the specified path:

The .tay file in the image above is 234kB in size, which is the historical record of the three Real-type variables in MAIN_XYZ over a two-minute period. Because it is in binary format, it is possible to calculate the effective file size.
The default cycle of the PLC is 10ms. In 2 minutes, the PLC runs 12,000 times, and records 3 Real data values per run, which is 12 bytes. Therefore, the size of the pure data is 144kB.
3*4* (2*60*1000/10) = 12*12000=144,000 bytes
Considering 12,000 rows of timestamps, each 64 bits is 8 bytes, totaling 96,000 bytes.
The total number of bytes occupied by numbers and time is: 144,000 + 96,000 = 240,000 bytes
However, 1kB of a computer is actually 1024 bytes, so no matter what format the data record is saved in, it should not be less than 240,000 / 1024 = 234.375 kB.
Compared to the screenshot of the.tay file size of 234kB, it can be seen that this is a pure binary file without any inserted tags.
2.4 Analytics data post-processing
The tay file is collected through ScopeView and then converted into other format files
The tay file is processed directly through Tc3ScopeExportTool.exe
Note: The .tas file cannot be deleted, otherwise the file cannot be used
2.4.1 Method 1: Export with TC3 Scope
(1) Execute the file TC3ScopeExportTool.exe
C:\TwinCAT\Functions\TF3300-Scope-Server\TC3ScopeExportTool.exe
or,
C:\TwinCAT\Functions\TE130X-Scope-View\TC3ScopeExportTool.exe

(2) Select Source and Destination
That is, the source file.tay and the target file, which can be.csv or.txt:

(3) Set file format, data channel and time

Then click Start, and a prompt indicating successful export should appear normally:

2.4.2 Method 2: Using TC3 Scope View
(1) Confirm that the computer on which TC XAE is installed has TE1300 authorization
To read historical data from the .tay file and display it as a curve requires TwinCAT ScopeProfessional authorization.
If not, a TrialLicense can be generated, which can display up to 5 variables.
(2) Create a new Measurement project
(3) Open the Target Browser and drag and drop the variable

You can select multiple variables at once and drag them to the ScopeProject.
(4) Start recording
Click the icon of Scope to start recording,

Data will be intercepted from the offline file.tay, just like the data recorded from the PLC on site:

As shown in the figure above, the .tay file records 2 minutes of data, and the curve displayed in Scope is 2 minutes.
If the number of variables exceeds 5, Scope Project will report an error, prompting the need for a formal TwinCAT Scope Professional license.

(5) Other analysis functions in Scope
After the .tay offline file data is loaded into Scope, it can be analyzed in the same way as online monitored variables, enabling all the analysis functions in Scope.
(6) Export from Scope to .csv
This is a standard function of Scope and will not be discussed in detail.
From the main menu Scope | Export, enter Export Template:

Then follow the prompts step by step.
3 PLC code mode:
3.1 Preparation
Both parties need authorization: TF6701 | TC3 IoT Communication
BACN library file installation: tc3_5gutilities.library,
Installation package: none
Controller: CX5130, WES7, TC3.1.4024.15(XAR)
Programming PC: laptop, Win10 64-bit, TC3.1.4024.15, VS2017, TcXaeShell
3.2 Project: TcMLFrameWork
Beckhoff China engineers created this sample project, encapsulating several key FBs, FB_MQTTClient for packaging structs to JSON format on the sending side and sending them to MQTT, FB_MQTTServer for receiving JSON data from MQTT on the receiving side and unpacking them into structs, and FB_StructDataSave for storing .csv files. Data that needs to be recorded is first placed in the struct ST_久久精品精品Data.
There is only one set of PLC programs in the sample project, and the role is switched through the global variable.bClient.
3.2.1 References

Note: TC3_Utilities in the image above is a newly added library. Please request a demo program from Beckhoff engineers. After finding this library file, you will need to install it separately.
3.2.2 Custom struct: ST_UserId
Note: Data that needs to be recorded is placed in this struct
TYPE ST_UserData: STRUCT. iRowIndex: UDINT; strDateTime: STRING; iSensorValue1: INT; iSensorValue2:BOOL; iSensorValue3: REAL; iSensorValue4: REAL; iSensorValue5: REAL; END_STRUCT END_TYPE |
3.2.3 Custom function blocks: FBs
(1) FB_MQTTClient
(2) FB_MQTTServer
(3) FB_StructDataSave
3.2.4 Global variable: GVL_Logger
Code, slightly
3.2.5 Global variable: GVL_test
Code, slightly
3.2.6 Global Variable: GVL
Code, slightly
3.2.7 Procedure: Main
Code, slightly
3.2.8 Procedure: PRG_Logger
Code, slightly
3.2.9 Procedure: PRG_Client
Code, slightly
3.3 Implementation results
3.3.1 Generation and transmission of data
Publish data to Message Broker in PRG_Client.
The data that needs to be recorded is placed in the struct User Data.
3.3.2 Receiving data
Receive and save data in PRG_Logger, from Message Broker, and save it to a local csv file.

This path is defined in the program PRG_Logger:
